Fixing cars correctly and keeping customers happy no longer ensures success, says George Hogan, business development manager for Axalta Coating Systems. With shrinking net profits throughout the industry, shop owners must manage their businesses by the numbers—starting with strong financial data.
Shops generate many financial documents through their accounting and management systems, but Hogan says profit-and-loss (P&L) statements are among the most important to regularly analyze. The P&L statement—also know as an income statement—is a financial document that summarizes your shop’s sales, costs and expenses for a period of time, and the gross and net profits that resulted from those activities. It reflects how your shop is performing from a financial perspective in specific areas of the business, and reveals where you’re headed in the future.
The problem, he says, is that many shop owners don’t understand what the P&L document means, what information it reveals, or why it’s significant to the business.
“A lot of shops aren’t reviewing it, they don’t know what to look for, and they’re intimidated by it,” Hogan says.
But shop operators can learn a lot about their business by understanding every line item outlined in the statement. Digging deep into the information can reveal several operational strengths and weaknesses within your shop, which can help you find and execute opportunities for financial improvement.
Hogan, with the help of two other financial experts at Axalta, walk us through a basic overview of the metrics displayed in your P&L. They explain what the numbers mean, where they should be, and how to interpret the information to effectively monitor and boost your financial performance.
Sales Mix
Patricia Mares, business development manager for Axalta’s Southern California, Arizona and Nevada district, says that sales mix is the first component shops should analyze when assessing their P&L. That’s the total amount of revenue the shop is generating, and how it is broken down into specific areas of sales. The sales mix percentage of total income generated by various profit centers of the business provides a snapshot of overall sales trends, which directly impacts gross profit percentages and opportunities to improve net profit margins.
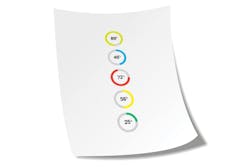
Industry Benchmarks:
NOTE: Benchmarks provided are general targets based on Axalta’s data on top performers in the industry.
Total Labor Sales •
Paint and Material Sales •
Parts Sales •
Sublet Sales •
What To Look For:
Every shop wants to see monthly and annual growth on the sales side of the business, Mares says.
Data Interpretation:
It’s a good sign if your sales mix remains above the industry benchmarks, says Ernie Vargas, business development manager for Axalta’s Kansas City district. For example, if paint and materials sales are above 10 percent, that likely means you’re getting paid for every paint operation without insurance caps.
Meanwhile, sales percentages below the industry benchmarks typically means there is a breakdown happening that requires attention. For example, say your labor sales are less than 50 percent. Mares says that might mean you have operational deficiencies, such as improper procedures for teardowns or blueprinting in order to identify every part and repair process that should be included on the estimate. It could also mean you have poor photo documentation or estimate notation processes that make it difficult to obtain approval for every necessary repair procedure.
“The sales metrics in your P&L are driven by your estimates,” Mares says. “Making sure you capture all possible items in the estimate really impacts the sales side.”
Cost of Goods Sold
Your cost of goods sold reveals the total monetary cash flow required to produce the repairs you sell—labor, paint and materials, parts and sublet.
Industry Benchmarks:
Total Cost of Goods Sold •
Labor Costs •
Paint and Material Costs •
Parts Costs •
Sublet Costs •
What To Look For:
Mares says it’s natural for shops to experience some amount of fluctuation in costs of goods sold depending on the monthly mix of repairs. But in general, shops want these numbers to remain relatively steady month to month.
Data Interpretation:
It’s a positive sign if your shop’s costs fall below these industry benchmarks. That means you’re paying less money for the labor, paint, materials and parts required for each job. For example, paint and material costs that are below 6 percent likely reveal that technicians are reducing waste and maximizing the life of every item used.
Costs that are routinely above these benchmarks means there is opportunity for improvement, Mares says. It might mean that you have inefficient processes, wasted resources or fewer parts discounts. Shop owners should immediately dig into the data to quickly identify why costs are increasing and develop a process to resolve the issue.
Gross Profit
Gross profit is the difference between total sales and the cost of goods sold—labor, parts, paint, materials and sublet.
Industry Benchmarks:
Total Gross Profit•
Labor Gross Profit •
Paint and Material Gross Profit •
Parts Gross Profit •
Sublet Gross Profit •
What To Look For:
The higher the gross profit is, the more money you have available to offset other operating expenses.
In addition to assessing gross profit percentages for the business overall, Hogan recommends assessing gross profit in a much more detailed fashion, such as specific labor and parts types. That helps identify whether you’re making the right amount of gross profit in different areas of the business so you know exactly where to look if there’s a problem.
For example, Hogan says most shops negotiate discounts for parts, but discounts for OEM and aftermarket parts vary widely—shops might get a 25 percent discount on OEM parts and 40 percent on aftermarket parts. If you have those part types broken down separately, you should expect to see a different gross profit for each of those categories.
“That helps you understand whether OEM and aftermarket discounts are actually being applied, and if they’re generating the amount of profit that they should,” Hogan says. “If you have all part types summarized together, you might see that there’s a problem but have no idea what it is.”
Data Interpretation:
If your gross profit percentage is below 40 percent, that means you have deficiencies with either your sales and estimating processes or your costs of goods. Your office staff may not be closing on a high percentage of jobs, your estimators might not be writing for every necessary item, or your costs of goods to produce repairs might be on the rise.
Assess the gross profit percentages for each of those specific areas to see where performance decreased. For example, lower labor gross profit could reveal that you paid a significant amount of overtime due to inefficient work, reduced paint and material gross profit could reveal waste, and reduced parts gross profit could mean you’re not obtaining the same discounts compared to the past.
Business Expenses
Business expenses include any overhead cost that’s not tied directly to a specific repair order, Hogan says. The items include everything that shop operators need to support their business that are not charged for on repair orders—rent, insurance, phone, utilities, uniforms, taxes, office supplies and marketing. The lower your business expenses are, the higher your net profit will be.
What To Look For:
The general rule of business is to maintain expenses at a level below the gross profit dollars generated, Hogan says. If your business expenses are higher than gross profit dollars, you’re losing money.
Vargas recommends skimming over the expense section of the P&L to look for anything out of the ordinary. Expenses like rent and software fees should remain the same every month. Identifying any glaring differences will reveal whether you neglected to pay a bill, paid a bill twice, or miscategorized a certain cost.
Mares also suggests using the expense section of the P&L to make sure you’re still operating in line with your budget. For example, most shops reserve 2–5 percent of income for marketing expenses. Make sure that same percentage is consistently applied to marketing every month.
Data Interpretation:
Vargas says assessing your monthly expenses creates opportunities to reduce costs for your business. You may not be getting the best possible deal for certain expenses, such as facility repairs and maintenance, office supplies, payroll costs, accounting fees or legal fees.
If your costs for those items appear out of whack, Vargas recommends consulting with your industry peers to find out what they’re paying for various services. There could be a more cost-effective service provider you could work with to reduce your shop’s monetary output.
Net Profit
Net profit is derived by subtracting your total business expenses from the total gross profit dollars. That’s the amount of money you have left over to either keep for yourself or invest back into the business.
Industry Benchmark:
Net Profit •
What To Look For:
The goal with net profit is an obvious one—get it as high as you can, into double digits if possible.
Data Interpretation:
Your shop is performing quite well if your net profit margin is higher than 10 percent, Mares says. That’s a strong indicator that your estimators are selling work properly, technicians are working efficiently, materials are not being wasted, you’re obtaining discounts from suppliers, and you’re keeping overhead expenses in check.
If your net profit is less than 10 percent, there is likely at least one area of business that needs improvement, Mares says. Shops with low net profit are generating deficient gross profit or inflated overhead costs. You may need to trim your budget and eliminate unnecessary programs if your overhead expenses are too high.


